Candidates for Michigan's Legislature

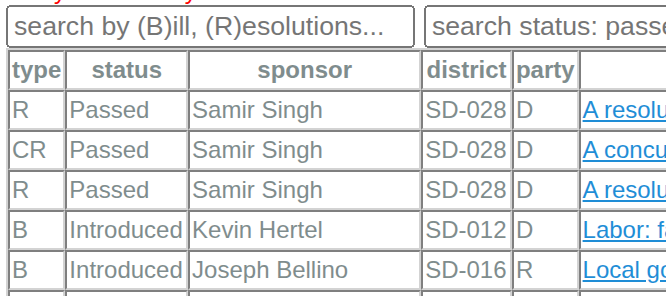
We've published our searchable summary of candidates' public voting records and support for Michigan's pro-choice, anti-gerrymandering and anti-choice petitions. We also summarized candidate demographics by party.

Age

Democratic candidates tend to be younger than than Republican candidates.
The most popular age among the Democrats is 45 years old; among Republicans it is 68. Democratic and Republican candidate age histograms

Gender

The Democratic party's candidate pool represents Michigan's gender split of 49.5% men to 50.5% women (α = 0.05).
The Republican party's candidates pool does not (p-val = 9.5e-11); Republicans are biased 3 to 1 towards men.
Democratic and Republican candidate gender pie chart

Estimated Ethnicity

Based on estimated ethnicities, (using the rethnicity package for R) 60% of the Democratic candidates and 73% of the Republicans are considered white.
Michigan as a whole is 78% white (α = 0.05).
The Democratic candidate pool over-represents non-white minorities; the Republicans are a statistical match for Michigan's non-minority population. Democratic and Republican candidate estimated ethnicity pie chart

Contact Us

Michigan Electorate
4007 Carpenter Rd #138
Ypsilanti MI 48197-9644

Our camaign finance reports are public.